
A busy week.
What did it deliver?
Recruitment reporting for your desk, team and agency. Follow work, margin and activity back to the records behind them.

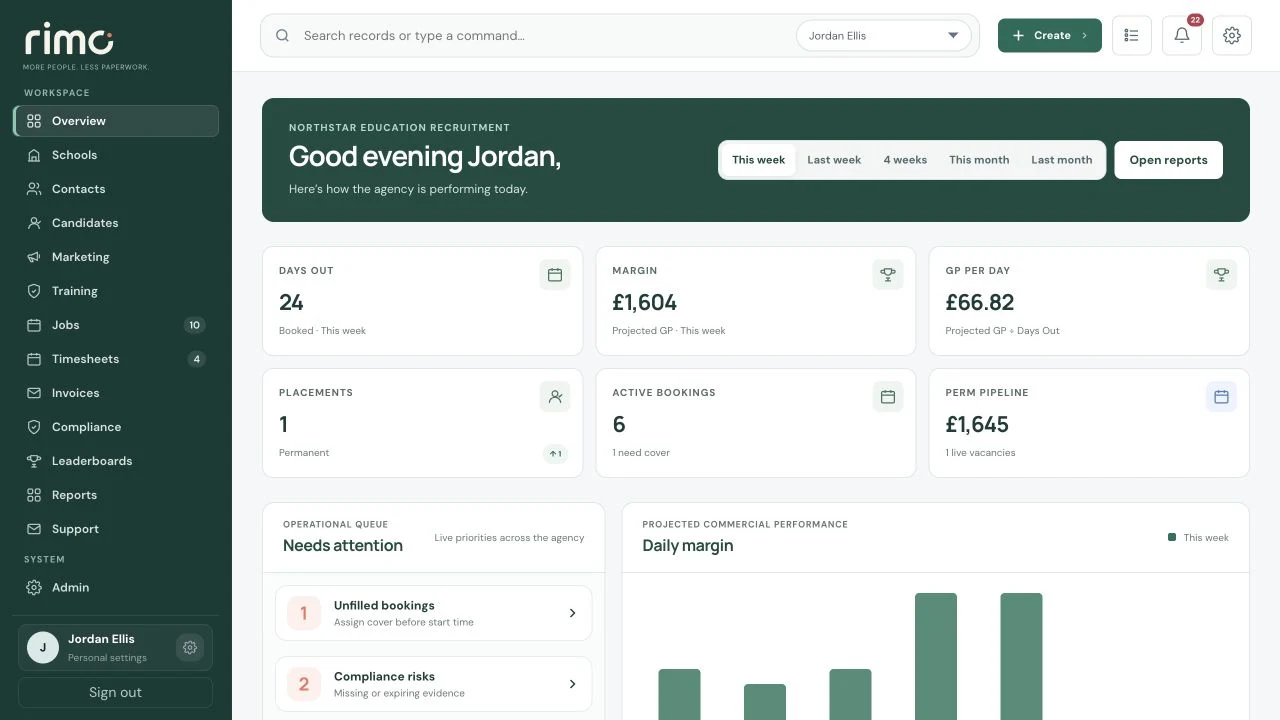
Product view · fictional demonstration data
What’s the number
telling you?
Choose a lens on this fictional Manager dashboard.
A diary full of work. What kind?
Days out, active Bookings and permanent Placements describe different parts of this example week. Keep the measure beside its meaning.
- Days out · booked this week
- 24
- Active Bookings
- 6
- Permanent Placement
- 1
The pound sign is only the beginning.
Projected gross profit is not turnover or take-home pay. Keep the work and its commercial assumptions behind the headline figure.
- Projected GP · this week
- £1,604
- Projected GP per day
- £66.82
- Permanent pipeline
- £1,645
Which number needs a conversation?
An unfilled Booking needs cover. Missing or expiring evidence needs review. The queue points to work for the team—not an automated clearance decision.
- Unfilled Booking
- 1
- Compliance risks
- 2
- The next action remains human
- Review
A guided reading of the dashboard above. Fictional demonstration data—not live reports or customer results.
The detail, when you need it
Ask the question.
Keep the context.
Use relevant dashboard views for Directors, Consultants, Compliance and Finance. Shared records connect activity with the work and commercial outcomes behind it.
- Agency performance
- Booking activity, team KPIs and commercial margin in the Manager dashboard.
- The individual desk
- Consultant priorities, follow-ups and progress towards placements.
- Readiness and approved work
- Priority evidence views and approved Timesheets support the specialist teams.
What would you like to know?
Bring the questions your desk, team or agency asks every week.